
Monitor the Redis cache of a WordPress site, without another tool.
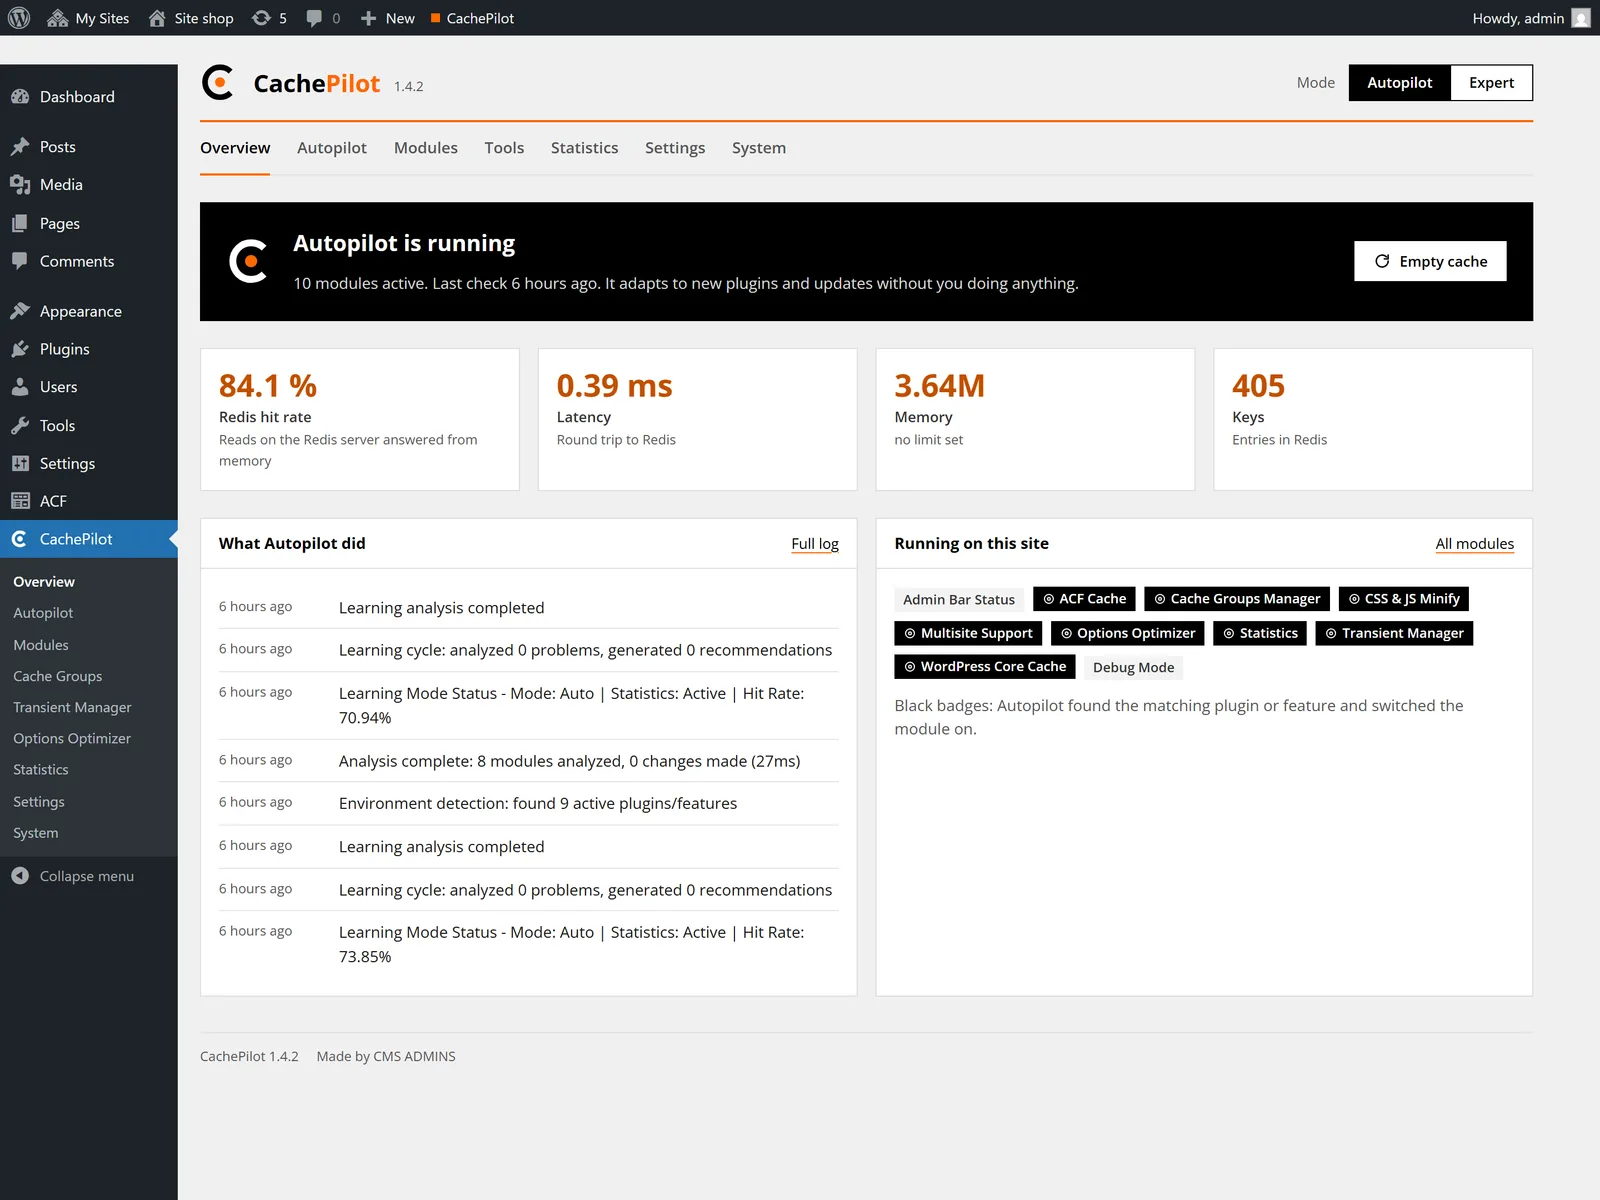
The Overview shows hit rate, latency and memory. The Autopilot log lists every decision. A weekly e-mail arrives only when Autopilot changed something or a problem needs attention.
CachePilot Status
Redis goes down, the site stays up
What the drop-in does when Redis stops answering, step by step. The times come from the defaults of CachePilot 1.4.2.
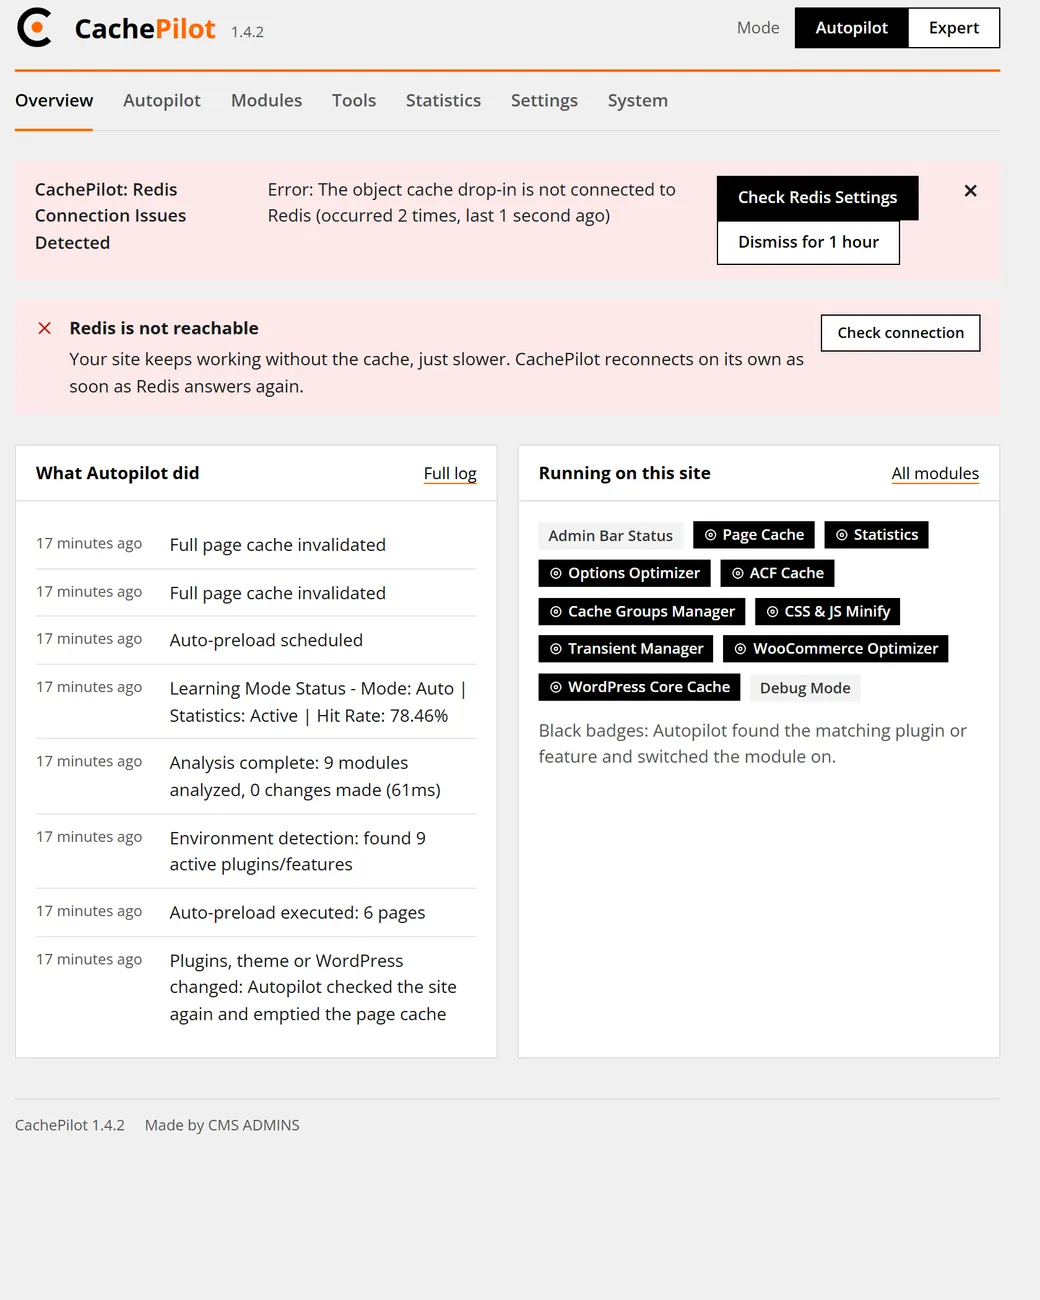
Redis stops answering
The next cache call waits at most for the connect timeout of 1 second.
Fallback
The drop-in marks Redis as down. WordPress reads from MySQL and the page is built as without a cache.
Next attempt
After 30 seconds the drop-in tries Redis again. Until then no request waits for it.
Redis answers again
The cache is emptied once, so no page is built from stale data.
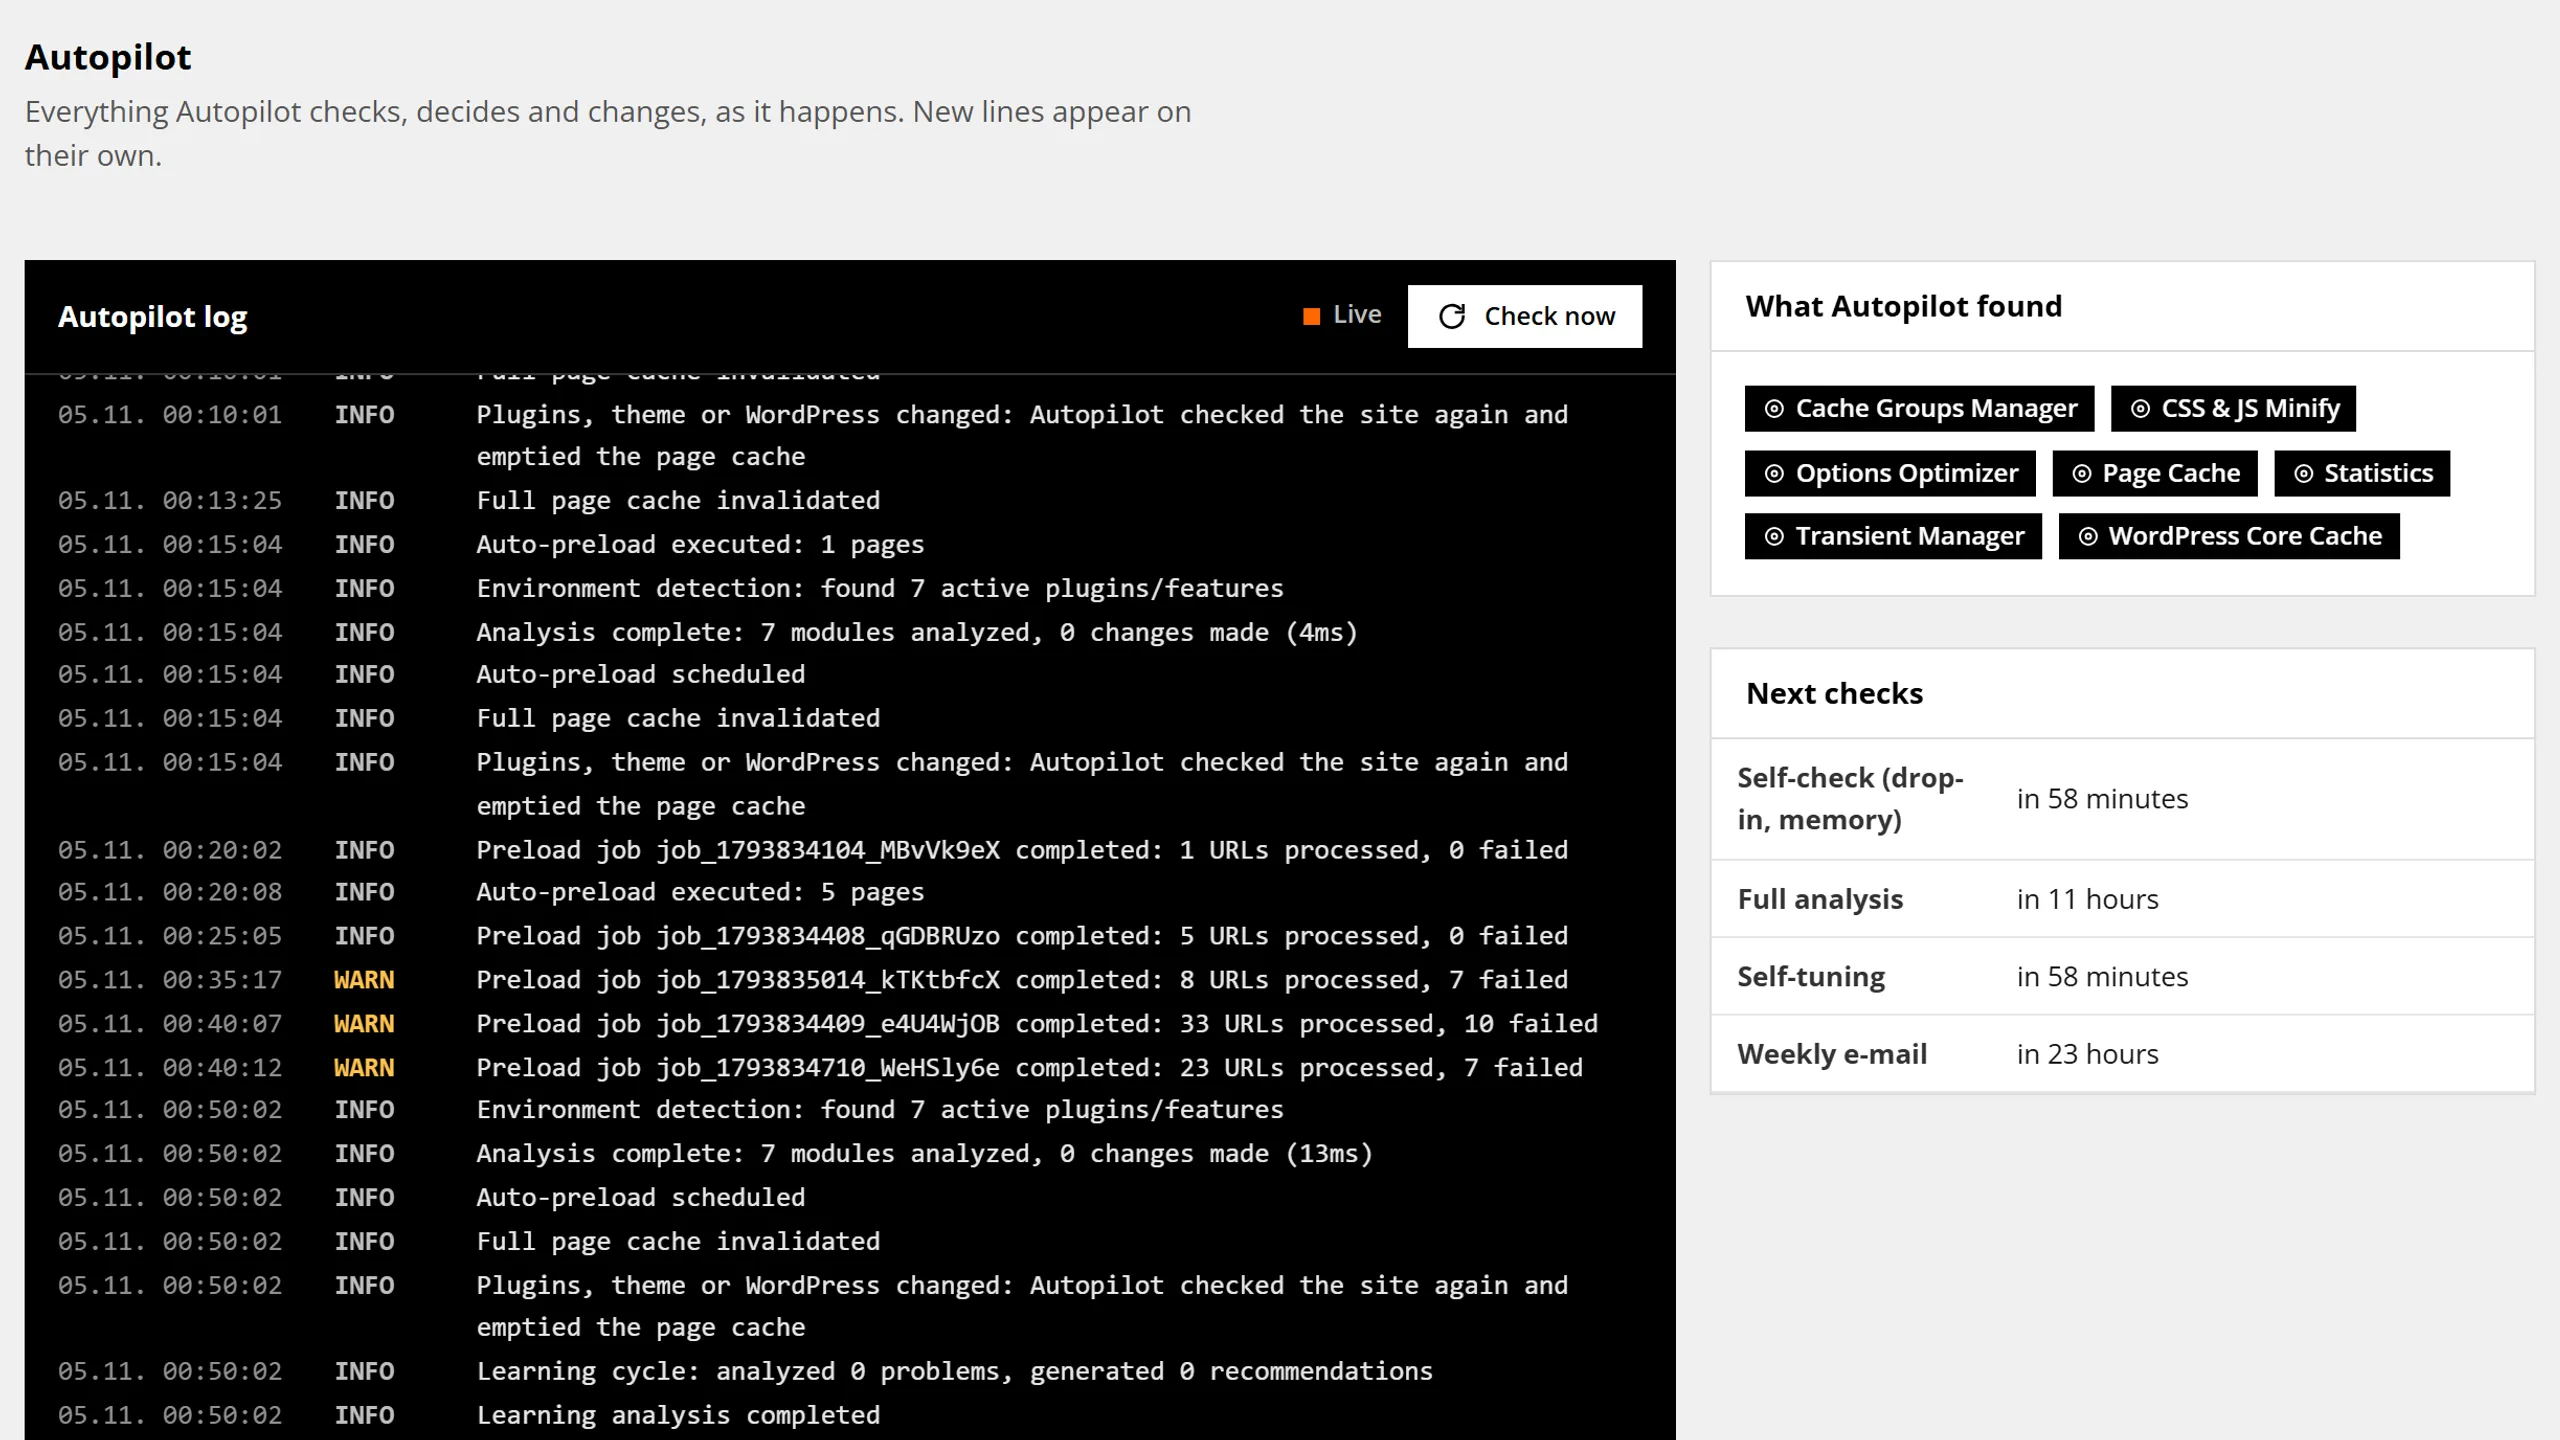
Autopilot log
Every decision in one log.
Setup, modules switched on or off, safety checks, re-checks after updates and options that stopped loading. Each entry says what happened and why, so a handover to a colleague or a client needs no extra notes.
Four places to look
Each screen answers one question about the cache.
-
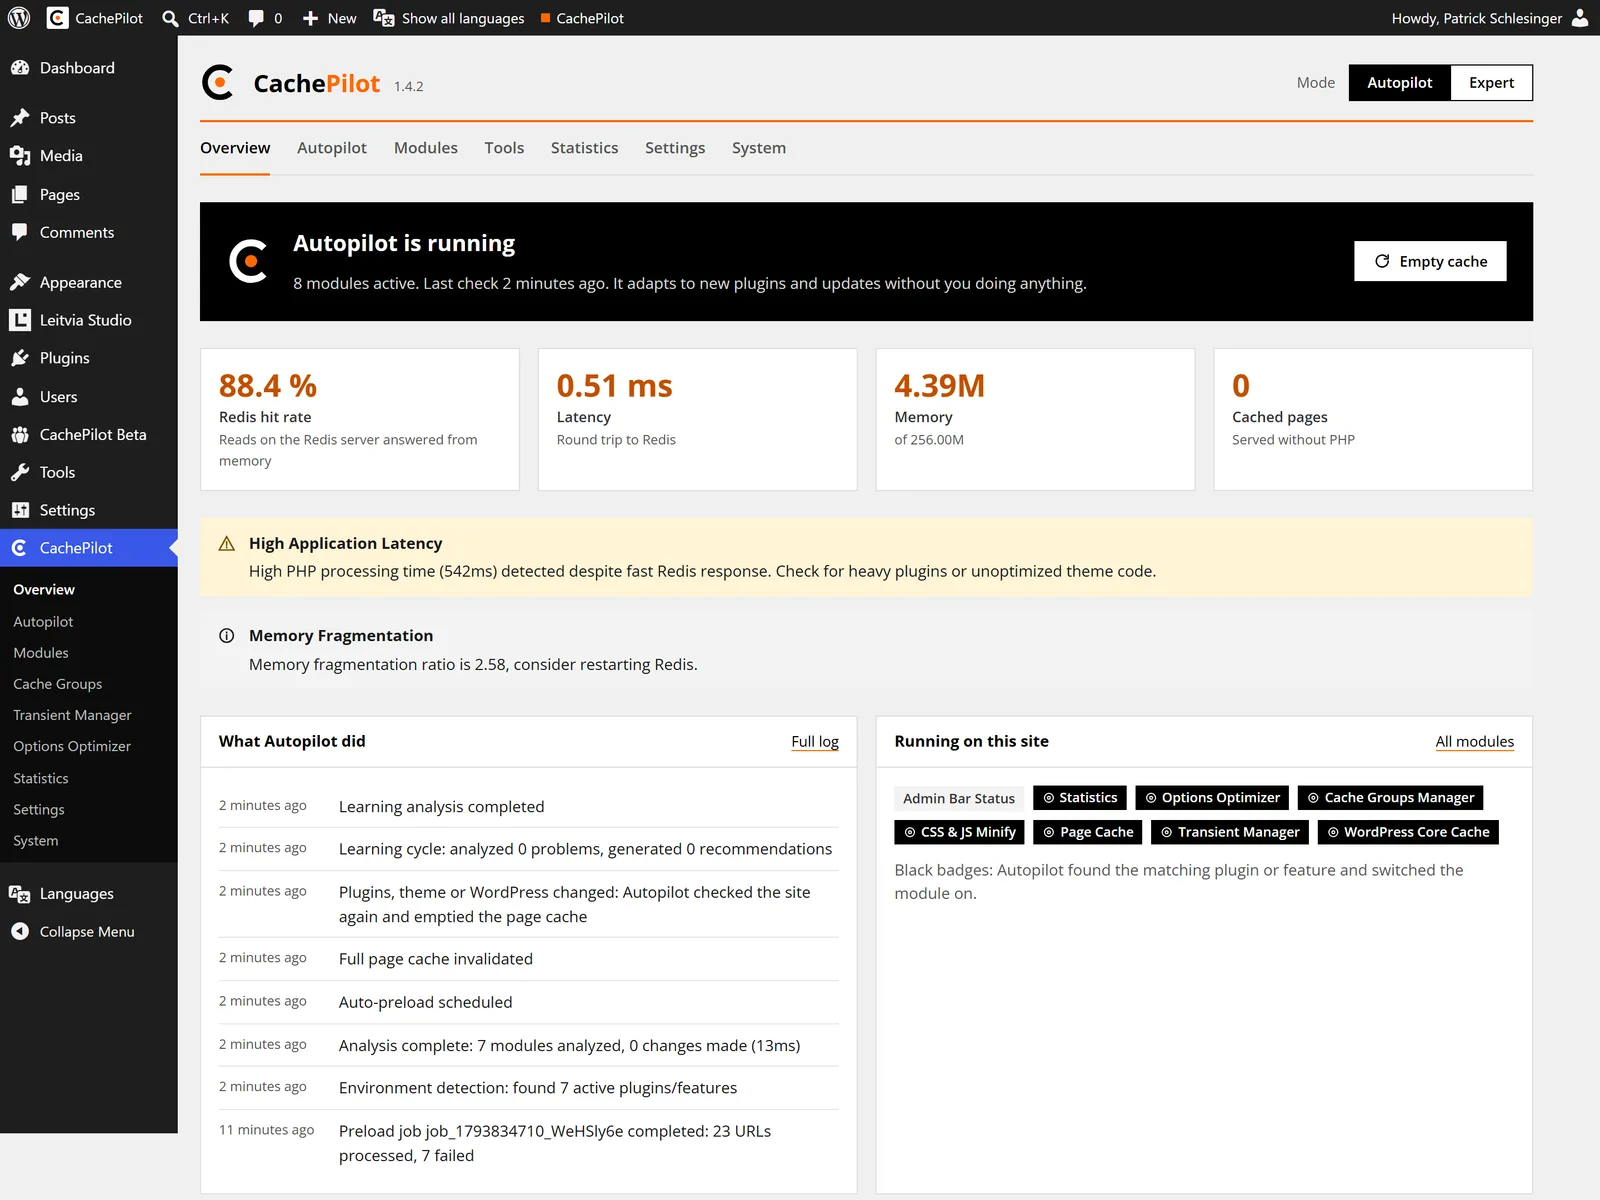
Is the cache working?
The Overview shows Autopilot status, hit rate, latency and memory and what Autopilot did last.
-
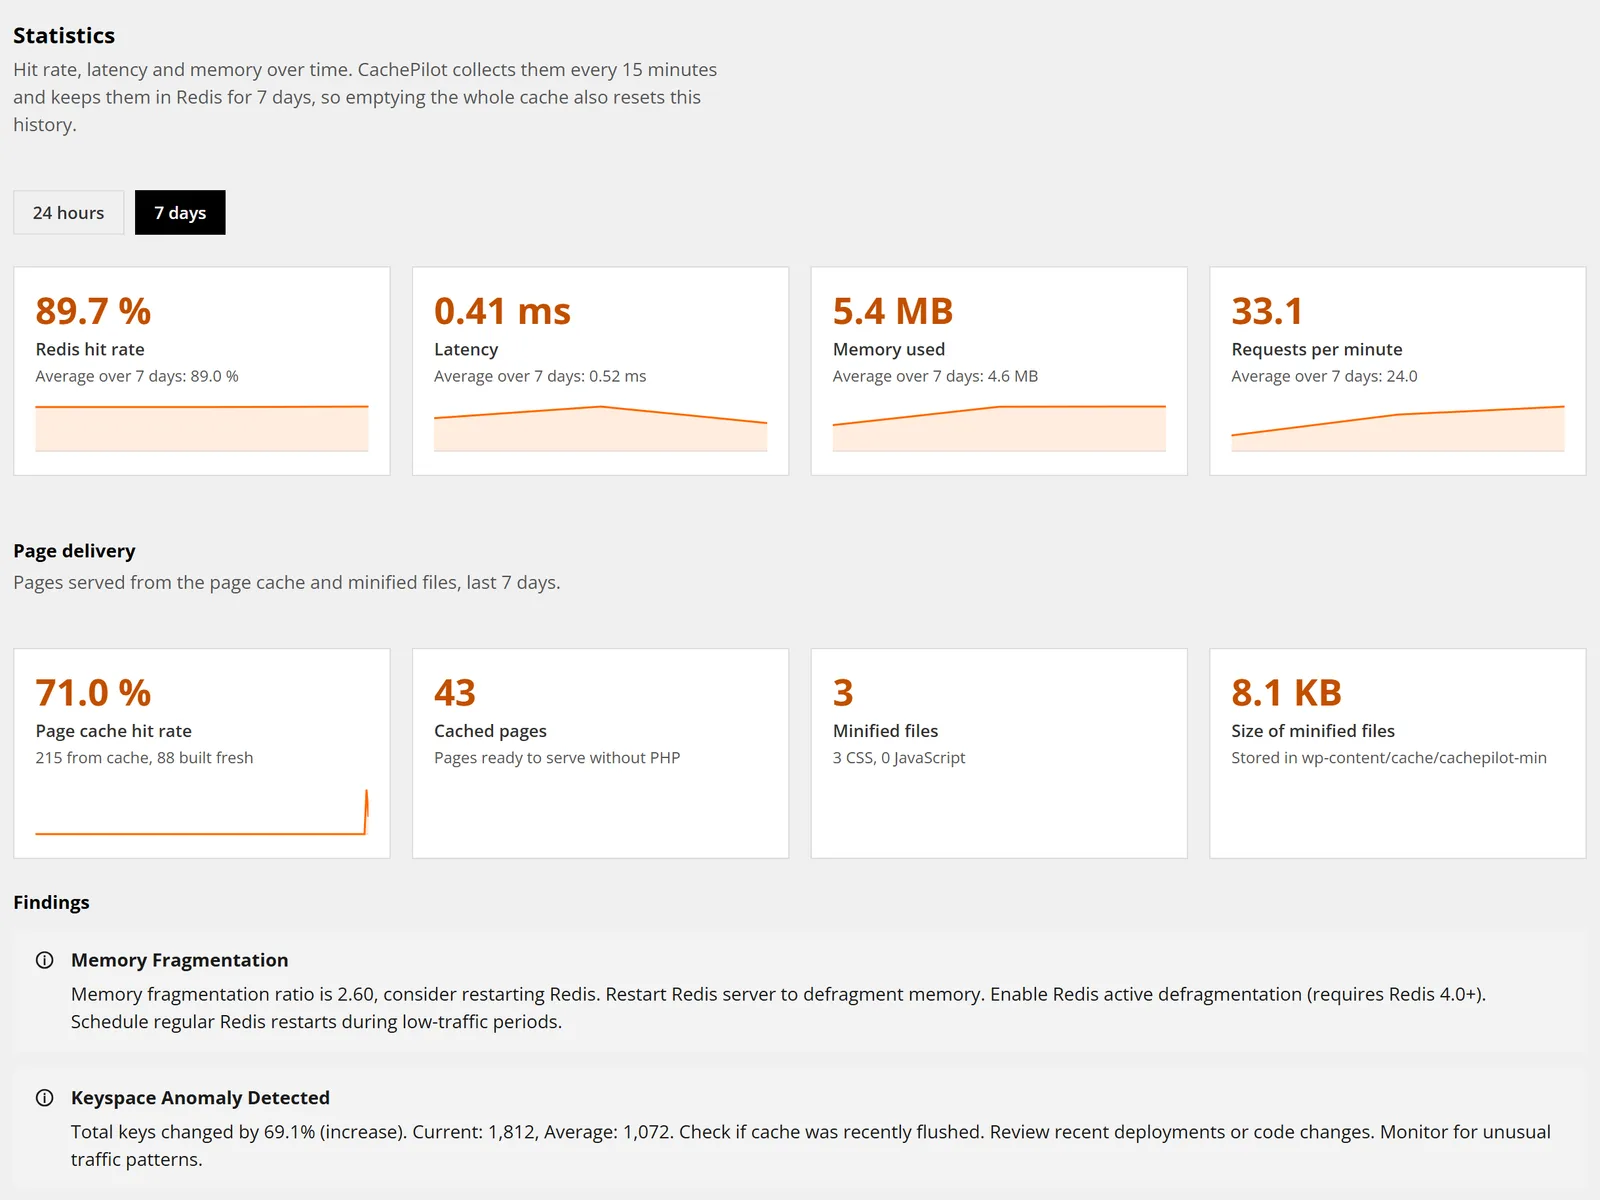
How did it do this week?
The Statistics page shows hit rate, latency, memory and page delivery over time, read with few Redis commands.
-
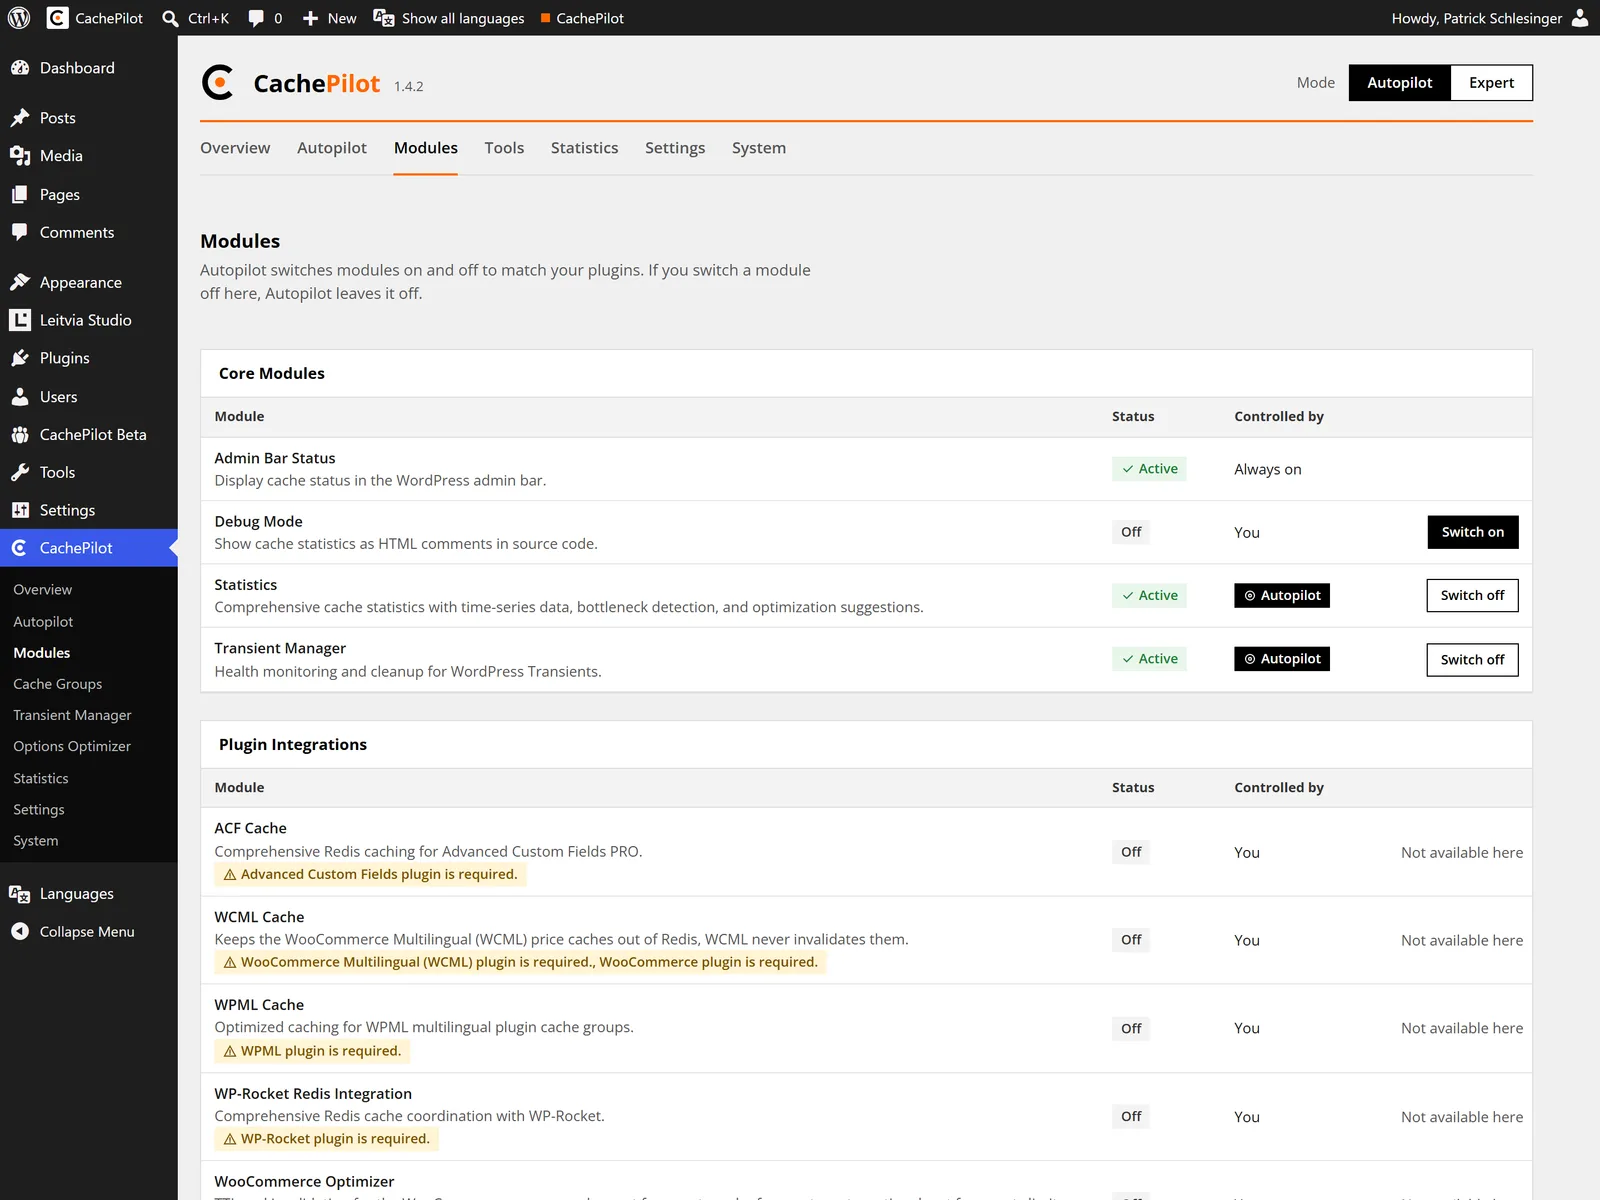
What runs on this site?
The Modules page lists every module, its status and whether Autopilot or you control it.
-
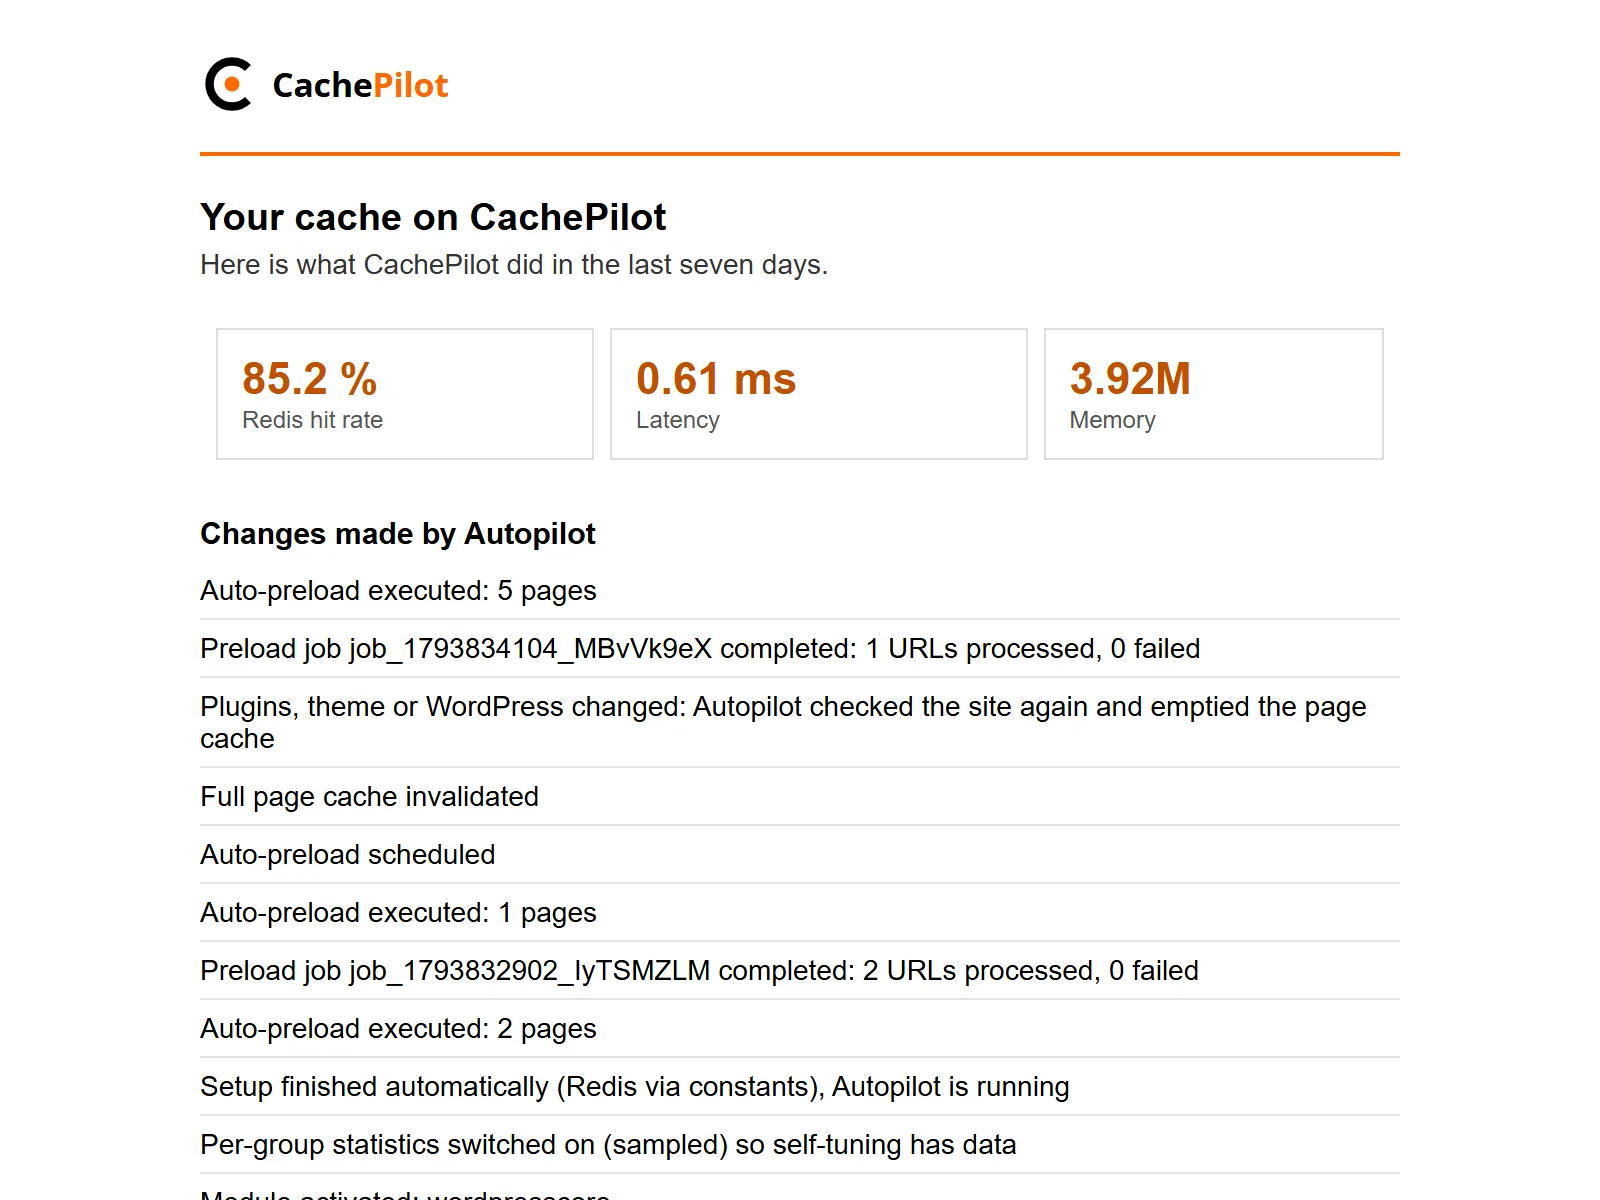
What should I know?
The weekly e-mail lists changes and problems. A week without either sends no e-mail.
Beta
Watch your own cache instead of guessing.
Join the beta and open the Overview after the first hour. The troubleshooting guide explains each warning.